
iPlot: An Intelligent Lighting Design Assistant
Andrew Perelson & Kimberle Koile
What
iPlot is an intelligent lighting design assistant. Given a performance space and a set of lighting goals, each specifying an area to be lit and a direction, iPlot explores the space of possible lighting arrangements in search of solutions that satisfy the goals. This arrangement is represented as a light plot—a two-dimensional top down view of the performance space, lighting pipes, and lights, all drawn to scale. iPlot employs a generate, test, and repair strategy: It generates a light plot, evaluates that light plot with respect to design goals, and uses an explanation to propose repair suggesions for any unsatisfied goals. It then uses the repair suggestions, which propose to modify a candidate solution or relax particular goals, to create new candidate solutions, which are then evaluated. This generate, test, and repair cycle continues until a solution is found, or iPlot runs out of repair suggestions to propose.
Why
iPlot supports the early stage of lighting design with the aim of helping designers quickly find an arrangement of lights that satisfies their design concept and physical lighting goals. We choose to focus on this area of lighting design because it is the one least covered by current lighting design tools. The process of going from a set of goals to a physical representation of their goals is one of the most time consuming and tedious for a designer. It involves an extensive search process, using trigonometry, geometry, and lighting design knowledge to map from the goal space to the solution space. Most lighting designers are not experts at the necessary math and use rough approximations when creating plots. Current tools help with some of the math necessary in this process, assisting the designer in finding a solution, but none attempt to generate an entire solution given the set of physical lighting goals. The system we are building acts as an intelligent design assistant, translating a designer's lighting goals into a recommended light plot, which represents the physical layout of the lights. With a tool such as iPlot, designers can explore many more design possibilities easily and quickly than is possible with currently available tools.
How
To accomplish its task of mapping physical lighting goals to a physical model of light positions, iPlot models a human designer's search process. Given a set of goals and preferred methods for satisfying each goal, it first assumes goal independence, and for each goal attempts to create a solution by adding a set of lights (represented by their type, hanging position, and focus point on stage) to an evolving model of the performance space. If the system fails to find a solution (because a needed light or position is unavailable), it attempts to find an acceptable solution by moving lights or relaxing goals.
iPlot employs knowledge about light specifications and the relationship between those specifications, physical positions in a theater, and lighting effects. Light manufacturers publish the specifications of their lights, including photometric information such as the beam and field angles, the intensity of the light, and how fast the intensity decreases as you move out from the center of the light. Using this photometric information, a set of light placements, and a model of the performance space, iPlot can predict what the stage will look like when the specified lights are turned on.
Conceptually iPlot consists of four components: (1) a physical model of the performance space for which a designer is creating a light plot; (2) a base of knowledge used to place lights, i.e. when and how to calculate the direction of a light beam and predict what a light will look like on stage; (3) a way of representing lighting goals---including an understanding of how they can be satisfieid, fail to be satisified, and ways of repairing goals that fail to be satisfied; (4) a search system that attempts to match lights and placements to goals. Parts one through three of this system form the domain knowledge needed to address the problem, while part four is the control structure that manipulates this knowledge to find a solution. The relationship between these four components is shown in Figure 2.
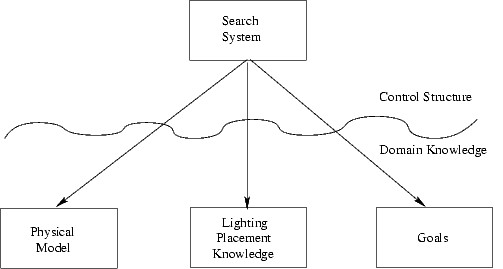
Figure 1. iPlot System Overview.
As an example of iPlot's functionality, a screenshot of the system's solution to a lighting problem is shown in Figure 2. The goals given to iPlot specified that two pools of light cover the entire stage. The first goal specified that the light beams come from downstage right; the second goal that the lights beams come from downstage left. In Figure 2, lights satisfying the first goal, of light from downstage right, are colored yellow (signifying that they are turned on). The white ellipses simulate the their light beams. Lights satisfying the second goal, of light from downstage left, are colored blue in the figure.
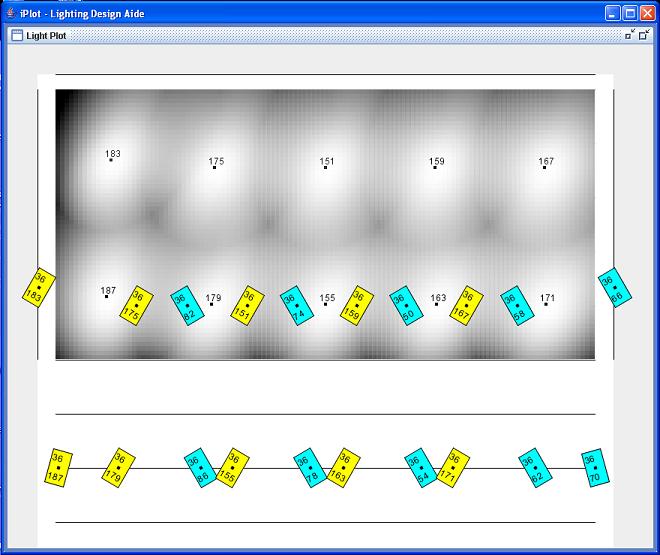
Figure 2. iPlot Screenshot. The lights in yellow are on and the predicted light beams shown on stage in white.
Future
When designing a light plot for a new production, designers often use past designs as starting points. In the next version of iPlot, we plan to add a case-based reasoning system, which will give designers easy access to their previous designs. The designs will be indexed by attributes currently used by designers, e.g., performance space, production, satisfied goals, failed goals, fixes for goals, light types. Storing information about fixes and failed goals will be important because designers often retrieve a production by remembering a difficult or interesting problem that was solved. The next version of iPolt also will include a more refined physical model, able to handle a greater variety of performance spaces and lighting instruments.
Research Support
This research is supported the MIT Project Oxygen partnership.
The Stata Center, Building 32 - 32 Vassar Street - Cambridge, MA 02139 - USA tel:+1-617-253-0073 - publications@csail.mit.edu (Note: On July 1, 2003, the AI Lab and LCS merged to form CSAIL.) |