
Computationally Increasing Microarray Resolution
Alex Rolfe, Julia Zeitlinger, Alan Qi, & Robin Dowell
Recent microarray designs for ChIP-chip experiments contain numerous small probes that produce dependent signals. Our analysis method fits a hypothesis about the locations of transcription factor binding events to the observed data to correct for noisy data and increase the effective resolution of the array. The resulting maximum likelihood estimate of the actual binding can determine the position of the GCN4 binding events to better than one hundred bases, nearly tripling the array's resolution.
Model
The signal dependence between probes depends on the probe spacing and the lengths of the hybridized DNA fragments. The sonication step of the location analysis protocol breaks the genomic DNA into small pieces. Each break occurs along the backbone of the DNA molecule between two adjacent bases in the sequence. We fit a gamma distribution to the observed fragment length distribution. Using the resulting p(l), the probability of a fragment of length l, we can find the expected intensity observed at a probe d bases from a binding site:

For each fragment length, the contribution to the intensity increases linearly with the length of the fragment. The relative abundance of fragments of length l is p(l). (l-d)/l describes the fraction of fragments of length l among those pulled down by the IP that also include the probe d bases away. The PCR amplification step limits the maximum fragment length, D, to about 1kb.
Imagine evenly spaced binding locations, bi (collectively the vector B), and the unevenly spaced probes, xj.
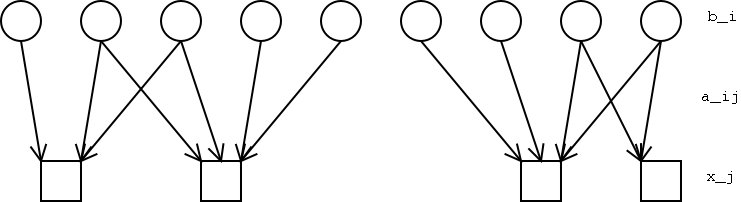
Intuitively, our method tries to find assignments of ``binding'' to the unobserved bi variables such that the resulting predicted intensities most closely match the observed values. For each probe-binding site pair, aij describes the relative intensity of signal at xj given binding at bi.Thus the expected signal at xj is
 .
.
Since the observations are noisy, we assume that xj follows a normal distribution with this mean and some variance:

We use a Quadratic Program to find the maximum likelihood estimate for B, that is, the set of binding events that best fit the data.
Results
We compared our method to the standard Rosetta method [1] to determine how well it identifies GCN4 targets (80 examples) and non-targets (200 examples) and how well each method identifies the actual binding site (based on GCN4 motif presence). Both methods achieve an ROC curve area of .97 on the test set. The MLE binding predictions fall, on average, 80 bases from the nearest GCN4 motif in the 72 positive examples found. The Rosetta calls fall an average of 114 bases away from the 70 positive examples found.
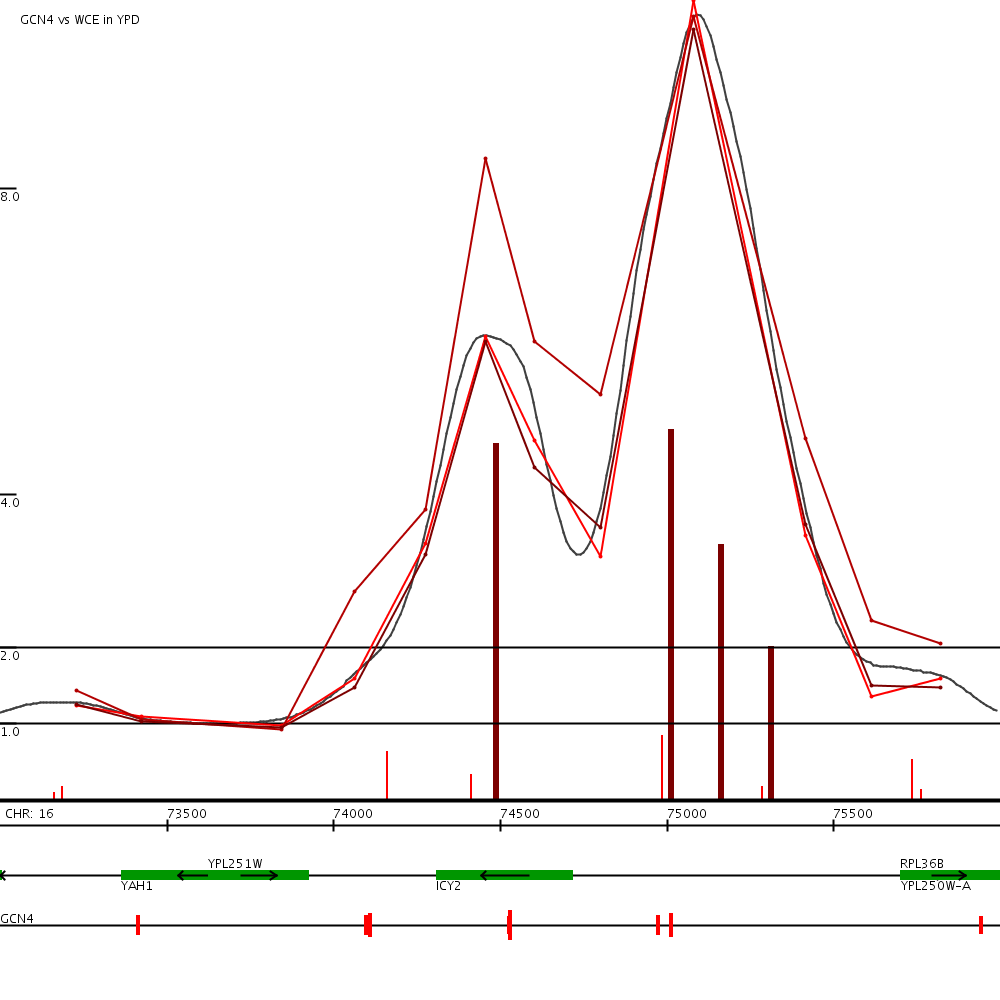
This examples shows our binding predictions (green vertical bars) near for GCN4 near the yeast gene ICY2 (click to expand). The green horizontal tracks show the data from the three replicates of this experiment. The tracks at the bottom show ORFs and GCN4 motif locations.
References
[1] Roberts and Nelson et al. Signaling and Circuitry of Multiple MAPK Pathways Revealed by a Matrix of Global Gene Expression Profiles. Science, pp 873-880, February 2000.
The Stata Center, Building 32 - 32 Vassar Street - Cambridge, MA 02139 - USA tel:+1-617-253-0073 - publications@csail.mit.edu (Note: On July 1, 2003, the AI Lab and LCS merged to form CSAIL.) |