
Building the Temporal Network Model of BCR Gene Expression in CLL
Corey Kemper, John Fisher & Laurent Vallat
The Problem
Currently, the disease process for B cell chronic lymphocytic leukemia (B-CLL) is not well understood at the genomic level. We are attempting to build the disease-dependent regulatory network for B-CLL given time series gene expression data. This requires selecting out the relevant genes and then determining how these genes interact with each over time. Given our extremely limited amount of patient data, we must assume a level of simplicity and sparsity in our models.
Previous Work
Gene regulatory networks have been studied for simple organisms, such as yeast[1]. Co-expression networks for a variety of species and cell types have been built that relate genes that behave similarly under varying experimental conditions[2][3]. These methods, while they do aid in the understanding of how the entire cell regulatory system works, are not disease specific and generally fail to utilize time series data. For genomic research specific to CLL, the work tends to be on a single gene basis, i.e. finding a genetic mutation that is common to a patient subgroup[4][5].
Motivation
CLL results from an acquired unknown injury to the DNA of a single cell in the bone marrow, creating an apoptosis defect. This change in the cell's DNA confers a growth and survival advantage on the cell, and these abnormal lymphocytes accumulate in the blood. CLL is treated by chemotherapy, radiation therapy, biological therapy, or bone marrow transplantation, depending on the exact diagnosis and the progression of the disease. A deeper understanding of the underlying molecular mechanisms that make the cells behave abnormally will allow for better treatment decisions. Additionally, depending on the structure of the network, we will eventually be able to do gene targeting in order to fix what is wrong in the cell.
Approach
The first step is acquiring the data. The B cell receptor (BCR) is stimulated in isolated B cells. Using Affymetrix microarray chips, we measure the difference in RNA expression levels for 54,613 genes at 4 timepoints after stimulation.
We now need to select out genes that are biologically relevant to the BCR pathway. Because stimulating the BCR virtually resets the clock of the pathway, we are able to classify genes in terms of their expression profile over time. We define 5 classes of genes. Classes 1 through 4 are composed of the genes that are predominantly expressed at the corresponding timepoint, e.g. Class 1 genes have high expression at the first timepoint and relatively lower expression at the other three timepoints. Expression is modeled as a 4th order Gamma distribution at the timepoint corresponding to the genes class label and as a Laplacian distribution elsewhere. The final class is the background, which is composed of genes that are not differentially activated with BCR stimulation and are modeled by a zero-mean Gaussian distribution at each of the 4 timepoints. We use the Expectation-Maximization Algorithm to estimate the parameters of the distributions and the class memberships of each gene.
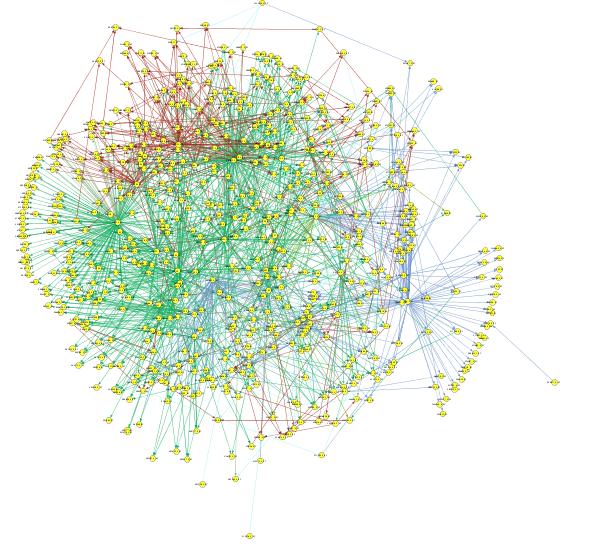
Given that we have determined which genes we would like to use to build the network and their class labels, we compute causal, linear matrices that relate one class to another. Using every possible gene pair in Class 1 and Class 2, we compute a matrix F12 that minimizes the squared error of Class 1 genes predicting Class 2 genes. This is repeated for F13, F14, F23, F24, and F34. At this point, every gene has an associated prediction, depending on the label of the gene it is predicting. Those predictions are then combined to best estimate each output gene, while limiting the number of possible inputs with a sparsity constraint. An example network is shown below.
Future:
There is considerable work left to do to validate these models and determine their biological and statistical significance. Wed like to relate networks from different patient subgroups and quantify where, how, and why they differ. Also, acquiring data on the same set of genes when other pathways are active will allow us to further refine what parts of the network are specific to BCR stimulation. Finally, the ultimate goal of the project is identifying target genes that relate to the apoptosis defect, predicting the results of altering those genes, and comparing the predictions to the actual experiments.
References
[1] Seiya Imoto, Tomoyuki Higuchi, Takao Goto, Kousuke Tashiro, Satoru Kuhara, and Satoru Miyano. Combining Microarrays and Biological Knowledge for Estimating Gene Networks via Bayesian Networks. In Proceedings of the Computational Biosystems Informatics, Stanford, CA, USA, August 2003.
[2] Dongxiao Zhu and Alfred O. Hero. Gene Co-expression network discovery with controlled statistical and biological significance. In IEEE International Conference on Acoustics, Speech, and Signal Processing, Philadelphia, PA, USA, March 2005.
[3] Katia Basso, Adam A. Margolin, Gustavo Stolovitzky, Ulf Klein Riccardo Dalla-Favera, and Andrea Califano. Reverse Engineering of Regulatory Networks in Human B Cells. Nature Genetics, Advance Online Publication, pp. 1-9, March 2005.
[4] Iole Cordone, Serena Masi, Francesca Romana Mauro, Silvia Soddu, Ornella Morsilli, Tiziana Valentini, Maria Luce Vegna, Cesare Guglielmi, Francesca Mancini, Sonia Giuliacci, Ada Sacchi, Franco Mandelli, and Robert Foa. p53 Expression in B-Cell Chronic Lymphocytic Leukemia: A Marker of Disease Progression and Poor Prognosis. Blood, Vol 91, No 11, pp. 4342-4349, June 1998.
[5] Peter E. Crossen. Genes and Chromosomes in Chronic B-cell Leukemia, Cancer Genet Cytogenet, Vol 94, pp. 44-51, 1997.
The Stata Center, Building 32 - 32 Vassar Street - Cambridge, MA 02139 - USA tel:+1-617-253-0073 - publications@csail.mit.edu (Note: On July 1, 2003, the AI Lab and LCS merged to form CSAIL.) |