
Multi-BUS: An Algorithm for Resolving Multi-species Gene Correspondence and Gene Family Relationships
M. Rasmussen & M. Kellis
Introduction
Comparative genomics is playing a central role in the systematic understanding of genes and regulatory elements in the human genome. The first step of any comparative analysis is to determine the correspondence of genes and regions across the species compared.
Here, we address this problem and present the Multi-BUS algorithm for resolving gene correspondence across multiple species. The algorithm works with the graph representing all similarity relationships across homologous genes, both within each species and across each pair of species. Multi-BUS works by progressively refining the correspondence of genes, and the correspondence of regions across the multiple species. Based on contiguous one-to-one orthologous genes, it constructs synteny blocks across the multiple genomes, inferring blocks of conserved gene order transitively across the multiple species. It also integrates cross-species conservation with gene family information within each species, to understand the gene family expansions and contractions that have shaped each genome since their divergence. In particular, the addition of within-species gene alignment scores enables us to distinguish gene loss and deletion events, as inferred by gene family phylogeny and confirmed by the multiple species, thus building synteny blocks even across duplicated regions.
Comparison with Previous Work
In order to make comparisons of genomes, a correspondence of genes and regions must first be established. Previous work has stated this problem in many ways, such as finding the best one-to-one correspondence of genes between genomes or finding a whole genome alignment. However, these formulations are unable to capture frequent and interesting evolutionary events such as segment duplication, gene loss, or rearrangements.
For example, Best Bidirectional Hits (BBH) [4, 5] identifies gene pairs that are best matches of each other and marks them as orthologous. In the case of recent gene duplication however, only one of the duplicated genes will be marked as the ortholog without signaling the presence of additional homologs, thus creating and incomplete and misleading correspondence.
Multiple genome correspondence has been addressed by MultiZ [1], Avid [2], and mLagan [3], with a focus towards producing a multiple alignment of the species compared. Some of these tools present the option of chaining links to only align those that are in the same order across species. However, these tools only focus on the best match of each region, without calculating or reporting gene duplication events, and therefore are not applicable in this case.
Clusters of Orthologous Genes(COG) [8, 9] goes a step further and matches groups of genes to groups of genes. Unfortunately, the grouping is too coarse, and clusters of orthologous genes typically correspond to gene families that may have expanded before the divergence of the species compared. This inability to distinguish recent duplication events from more ancient duplication events makes it inapplicable for building correspondence maps.
Methods
We produced multiple genome correspondence maps by developing a new algorithm, MultiBUS, an extension of the BUS algorithm for pair-wise species comparison [6, 7]. The algorithm builds upon both BBHs and COGs to resolve the correspondence of genes across a pair of species. It starts with the full bi-partite graph of gene similarities between two genomes, and derived Best Unambiguous Subsets (BUS) of genes, defined as the smallest set S of genes such that each gene's best match is in S and no gene in S is the best match of a gene outside S. The definition of best matches allowed incorporation of both protein sequence similarity, as well as conservation of gene order (synteny) between neighboring genes.
The original BUS algorithm works with a reference genome, upon which the additional species were projected to create a global alignment using ClustalW. In comparison, the MultiBUS algorithm works directly with multiple species by extending the concept of best unambiguous groups in bipartite graphs, to multi-partite graphs with the addition of self-matches. These graphs contain genes from all species as vertices, and represent pair-wise alignments of genes as edges weighted by their alignment scores. We also use self-matches, which are intra-species edges used to infer evolutionary events such as gene duplication and gene loss. MultiBUS determines synteny blocks, which we define as conserved regions across multiple genomes, inferred by gene order conservation transitively across the graph of connectivity (Figure 1). The power of MultiBUS is its integration of gene family information, together with cross-species conservation to understand the evolutionary events that separate the species.
Initial graph construction
As input, MultiBUS uses the alignment score of each pair of genes stored in a symmetric matrix. This matrix may be sparse, since MultiBUS is searching specifically for edges with significantly high scores. From this matrix a bidirectional graph G is created, such that each gene is represented as a vertex and each given alignment score is represented as a weighted edge attached to its corresponding genes. We prune the edges by removing low-scoring matches that are unlikely to be useful in the final graph construction, thus speeding up the subsequent steps while leaving the output of the algorithm unchanged. We use a relative cutoff for pruning, by comparing the score of each edge to that of the best edge of each gene; we find that these relative scores are bimodal, and eliminate matches on the low scoring end of this distribution.
Synteny block construction
Synteny blocks are identified as sets of matches that connect genes with conserved order. This can be viewed as a partitioning of the edges in G, where each partition represents matches that participate in the same block. Not all edges appear in blocks, and thus many are marked as non-syntenic. Once synteny blocks are determined, MultiBUS eliminates edges that conflict with the overall synteny.
Gene family construction
Gene family construction is performed by finding best unambiguous subsets, adjusted to work on multiple species. We implement best unambiguous subsets as the connected components of a modified graph G', defined as the largest subgraph of G such that each edge is a best match of at least one gene. Once gene families are determined, non-best matches that conflict with the families are pruned. Additionally, matches that are consistent with the gene family partition are resurrected, even if they were initially pruned to construct synteny blocks.
Results
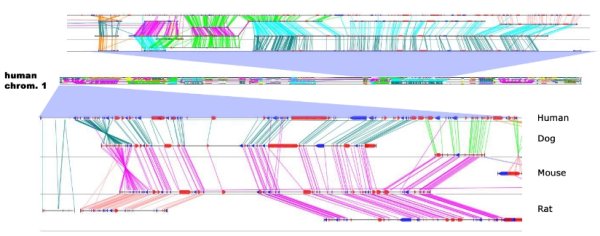
We applied this algorithm to the four complete mammalian genomes, of human, mouse, rat, and dog. In each case, we used the publicly available annotations for these genomes downloaded from the Ensembl Genome Browser and used protein BLAST for the initial graph construction. In order to visualize our synteny, we developed a custom visualization tool, which allows interactive browsing and querying of the gene correspondence. A snapshot is shown in the figure above for the multiple mapping of human chromosome 1, together with its syntenic segments from the three other species, with the gene correspondence indicated by diagonal lines. Lines that span all four species indicate syntenic regions conserved across all species. Further detail of the gene correspondence can be seen in two close-ups of the chromosome map.
We found that gene family expansion was very frequent across the four mammals. For example, the largest gene family contained 56 mouse olfactory receptors, and only one human ortholog, showing the differential role of smell in the two mammals. It is indeed known that a large number of ancestral mammalian olfactory receptors have been rendered inactive in human, and are likely to be missing from the public annotation. Conversely, human showed vast expansions in immunoglobin genes with several homology groups containing only a handful of genes in mouse and rat, as compared to dozens of genes in human, evidence of the important role of disease resistance in the human lineage.
We also found that large chromosomal segments are well-conserved across the four species, allowing for global alignments. The four genomes map into 296 large synteny blocks, covering 73% of the human genome. Within these blocks, local inversions and small translocations are frequent, and marked accordingly. Overall, the genome can be partitioned in 2960 blocks of co-linear gene order across all four species.
Genome alignment and gene family construction have traditionally been seen as two orthogonal problems. Our unified framework for gene correspondence in fact addresses both problems simultaneously in a unified framework. By integrating synteny information and region correspondence, we are able to determine the correct gene correspondence across the species compared, and help understand the evolutionary events that have shaped their adaptation. Most importantly, this combined approach ensures that the 1-to-1 genes compared are indeed orthologs, and allows us to use them for discovery of functional features.
References
[1] Blanchette, M., Kent, W.J., Riemer, C., Elnitski, L., Smit, A.F., Roskin, K.M., Baertsch, R., Rosenbloom, K., Clawson, H., Green, E.D., Haussler, D. and Miller, W. Aligning multiple genomic sequences with the threaded blockset aligner. Genome Res, 14 (4). 708-715.
[2] Bray, N., Dubchak, I. and Pachter, L. AVID: A global alignment program. Genome Res, 13 (1). 97-102.
[3] Brudno, M., Poliakov, A., Salamov, A., Cooper, G.M., Sidow, A., Rubin, E.M., Solovyev, V., Batzoglou, S. and Dubchak, I. Automated whole-genome multiple alignment of rat, mouse, and human. Genome Res, 14 (4). 685-692.
[4] Fitch, W.M. Distinguishing homologous from analogous proteins. Syst Zool, 19 (2). 99-113.
[5] Fitch, W.M. Uses for evolutionary trees. Philos Trans R Soc Lond B Biol Sci, 349 (1327). 93-102.
[6] Kamvysselis, M., Patterson, N., Birren, B., Berger, B. and Lander, E.S. Whole-genome Comparative Annotation and Regulatory Motif Discovery in Multiple Yeast Species. Proc Int Conf on Res in Comp Mol Biol, 7. 157-166.
[7] Kellis, M., Patterson, N., Endrizzi, M., Birren, B. and Lander, E.S. Sequencing and comparison of yeast species to identify genes and regulatory elements. Nature, 423 (6937). 241-254.
The Stata Center, Building 32 - 32 Vassar Street - Cambridge, MA 02139 - USA tel:+1-617-253-0073 - publications@csail.mit.edu (Note: On July 1, 2003, the AI Lab and LCS merged to form CSAIL.) |