| Technical Reports | Work Products | Research Abstracts | Historical Collections |
![]()
|
Research
Abstracts - 2006
|
|
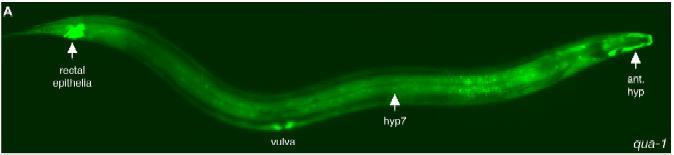
Predicting Synthetic Lethal Interactions During Embryonic DevelopmentPatrycja E. Missiuro & Hui GeMotivationOne major difficulty in studying an organism's development is that many single gene mutations do not give rise to any defective phenotypes. Such phenotypic stability is achieved as a result of genetic variability and environmental changes [1]. One of the major reasons underlying this phenotypic stability is that functionally redundant or overlapping genes buffer one another during development [2,3]. Some of those genes are similar in sequence, while others are not. Although this phenomenon has been observed for decades, no systematic search and validation process exists in order to discover gene pairs/groups involved in functional buffering in a developmental system. We plan to systematically identify potential gene pairs/groups that buffer each other's function during embryogenesis. We are going to take a predictive modeling approach that uses various sources of high-throughput data as input, and combine the predictions from these sources together. The results of modeling will be genome-wide predictions of genes that give rise to synthetic embryonic lethal phenotypes. upon mutating them together. Synthetic lethal is one type of genetic interaction. Subsequently, our predictions will be verified experimentally where the biologists of the group will use double RNA interference (RNAi) analysis to verify these predictions. BackgroundThe model organism we have selected is Caenorhabditis elegans, which is a small (about 1mm long) soil nematode (worm) found in temperate regions. C. elegans embryogenesis provides an excellent model for studying development: a zygote goes through asymmetric cell divisions, gastrulation and morphogenesis as the result of accurate regulation and coordination of a large number of genes and proteins. Classical genetic and molecular techniques have laid a solid foundation for elucidation of embryogenesis by characterizing individual components and connections of this process. A collection of known genetic interactions can be obtained by mining the existing C. elegans literature. However, each study based on traditional methods usually represents a small and selected set of genes.  Figure 1: C. elegans hemaphrodite. One possible way of obtaining a comprehensive list of gene pairs required for embryogenesis is to conduct double perturbation experiments (by making mutants or performing RNAi analysis) for all pair-wise combinations of non-essential genes. However, testing all pairwise combinations experimentally would be very expensive and time consuming, since the C. elegans genome contains approximately 19,000 genes thus leading to approximately 200 million pairwise combinations, making even high-thoughput tests not feasible. Research ApproachWe model the synthetic lethal interactions among non-essential genes, whose loss-of-function phenotypes are not embryonic lethal. Several genome-wide RNAi screens show that ~90% of genes in the C. elegans genome are non-essential, and only ~10% of single gene mutations give rise to embryonic lethality [4-7]. Our modeling approach to discover pairs or groups of non-essential genes that buffer one another?s functions. We have already collected the relevant high-thoughput data for C. elegans embryonic development and also, literature specific genetic interactions coming from individual experiments. The experimental data can be used to train our computational model. Therefore, we propose to formulate probabilistic models of ?genetic interaction modules? based on the gene sequences and high-throughput datasets, including results from
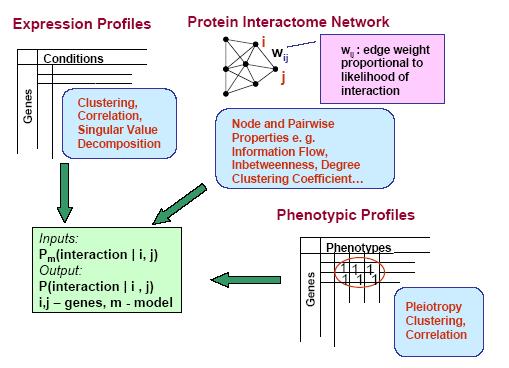 Figure 2: Computational model Functional connections can be inferred by integrating these high-throughput datasets relevant to embryonic development. The probabilistic models can help us prioritize double perturbation experiments that are mostly likely to identify functional buffering genes during development. Probabilistic modeling using high-throughput data
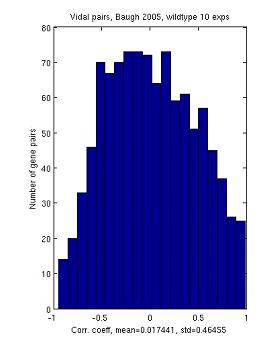
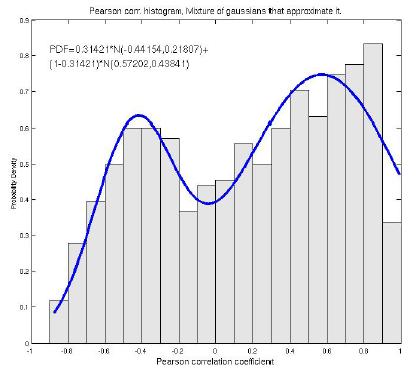
We have collected a set of experimentally tested genetic interactions and compared correlation scores between those gene pairs and random. Our results show a bimodal distribution, indicating that temporal expression profiles can be used as an indicator to predict synthetic lethal pairs.
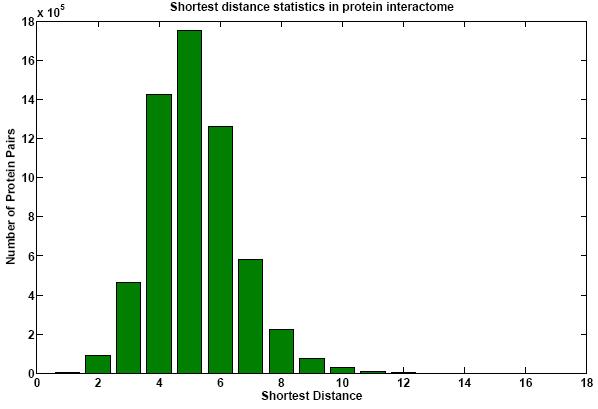
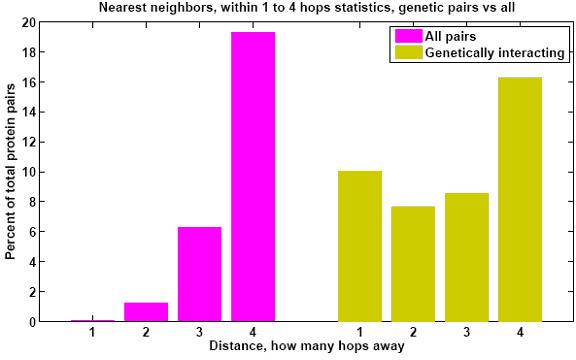
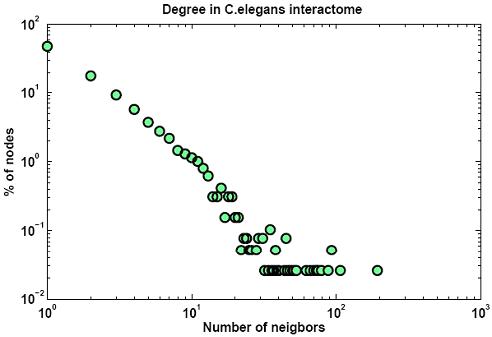
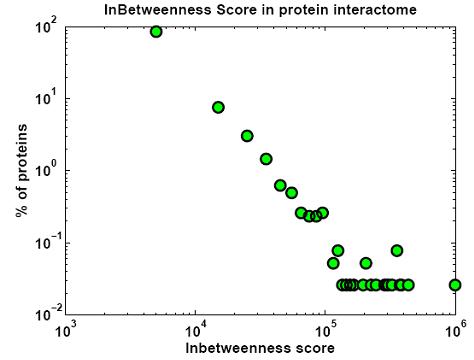
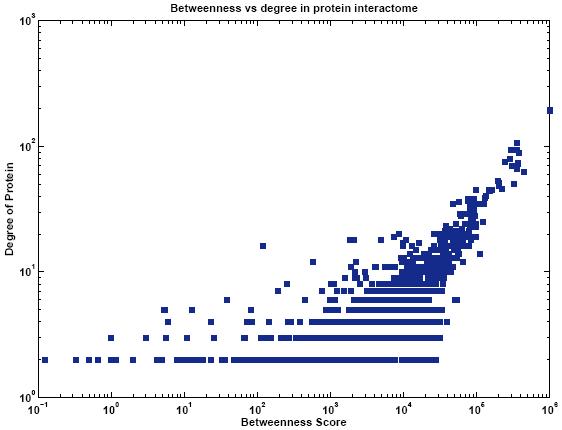
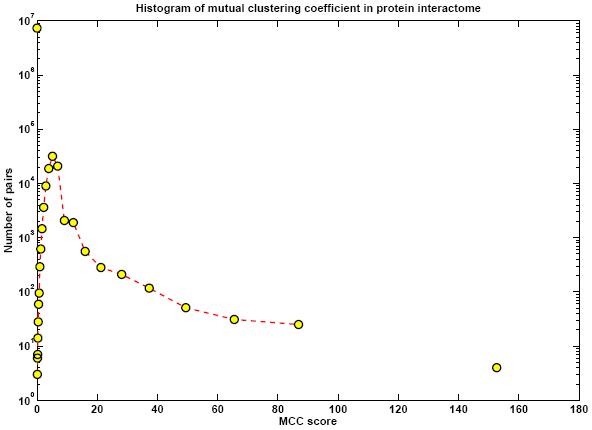
Protein networks (Interactomes) are obtained from high-throughput experiments such as Yeast-2-Hybrid (Y2H), Affinity Purification/Mass Spectroscopy, Protein arrays. Nodes in such networks represent proteins, and edges represent interactions that have been determined between pairs of proteins. The edges are assumed to be bidirectional. We believe that certain network properties can help us identify protein pairs/complexes that are regulated and work together. For example, proteins that perform similar function tend to be close to each other in the network. Also, protein pairs that are involved in genetic interactions tend to have a large number of common neighbors. Therefore, we analyze such network properties as clustering coefficient between pairs of nodes, information flow through particular nodes, the degree of a graph in a network, the shortest distance between pairs of nodes in a network, etc. We are looking into whether these properties are significantly different for genetic interaction pairs versus random. Figures below show some of the interactome properties studied.
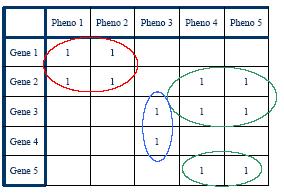
High-througput protein binding experiments are prone to many false positives. In order to increase the accuracy of the above statistics, we plan on refining the Interactome network by assigning weights to edges proportional to the probability of interaction. We plan on combining protein binding high-throughput data from C. elegans and related species such as Y2H, Affinity Purification, Protein Arrays, along with experimental observations, and use Bayesian network approach to estimate the likelihood of interaction for network edges. Phenotypic datasets can be divided into two categories: phenotypic profiles and expression patterns. Phenotypic profiles are annotations of defects observed when a gene is mutated/knocked-down. Expression patterns tell us where a gene is expressed. Both can give us clues about the feasibility of a protein-protein interaction based on the similarity of the localization patterns. Phenotypic profiles can point us genes with high degree of pleiotropy (causing many defects) and we plan on clustering genes based on their phenotypic profiles (Figure 10 (a)).
Combining predictionsWe will use machine learning algorithms to refine and subsequently combine models coming from high-throughput experiments. Our classifier will use the high-throughput data as the input, and predict pairs of genetic interactions as the output. We will use experimentally determined (high confidence) genetic interactions as training data (80%) and testing data (20%). We plan on experimenting with both unsupervised and supervised learning algorithms as possible choices for our classifier. We will evaluate the relative performance of classifiers, and choose the best one or a hybrid of many for our predictive modelling. Research SupportThe support of the Whitehead Institute is gratefully acknowledged.References:[1] John L. Hartman IV, Barbara Garvik, Lee Hartwell, Principles for the buffering of genetic variation, Science 2001, 291(5506):1001-1004. [2] Andreas Wagner, Robustness against mutations in genetic networks of yeast, Nature Genetics, 24:355, 2000. [3] Z. Gu, L. M. Steinmetz, X. Gu, C. Scharfe, et al., Role of duplicate genes in genetic robustness against null mutations, Nature , 421:63-66. [4] Sonnichsen B, Koski LB, Walsh A et al., Full genome RNAi profiling of early embryogenesis in Caenorhabditis elegans, Nature, 434:462 (2005) [5] Simmer F, Moorman C, van der Linden et al., Genome-Wide RNAi of C. elegans Using the Hypersensitive rrf-3 Strain Reveals Novel Gene Functions, PloS Biology, 1:E12 (2003) [6] Kamath RS, Fraser AG, Dong Y et al., Systematic functional analysis of the Caenorhabditis elegans genome using RNAi, Nature, 421:231 (2003) [7] Maeda I, Kohara Y, Yamamoto M et al., Large-scale analysis of gene function in Caenorhabditis elegans by high-throughput RNAi, Current Biology, 11:171 (2001). [8] Baugh LR, Hill AA, Claggett JM et al., The homeodomain protein PAL-1 specifies a lineage-specific regulatory network in the C. elegans embryo, Development, 132:1843 (2005) [9] Siming Li, Christopher M. Armstrong, Nicolas Bertin, Hui Ge et al., Map of the Interactome Network of the Metazoan C. elegans, Science, 303:540 (2004). [10] Gunsalus KC, Ge H, Schetter AJ et al., Predictive models of molecular machines involved in early C. elegans embryogenesis, Nature, 436:861 (2005) [11] Tong AH, Lesage G, Bader GB et al., Global mapping of the yeast genetic interaction network, Science, 303:808 (2004) [12] Baugh LR, Wen JC, Hill AA et al., Synthetic lethal analysis of Caenorhabditis elegans posterior embryonic patterning genes identifies conserved genetic interactions, Genome Biology, 6:R45 (2005) [13] Rhodes DR, Tomlins SA, Varambally S et al., Probabilistic model of the human protein-protein interaction network, Nature Biotechnology, 23:951 (2005) [14] Alison R. Frand, Sascha Russel, Gary Ruvkun. Functional Genomic Analysis of C. elegans Molting, In PLOS Biology, volume 3, issue 10, October 2005. [15] Baugh LR, Hill AA, Slonim DK, Brown EL, Hunter CP, Composition and dynamics of the Caenorhabditis elegans early embryonic transcriptome, Development, 130:889-900, (2003). |
|||||||||||||||||||||||
|