
| Technical Reports | Work Products | Research Abstracts | Historical Collections |
![]()
|
Research
Abstracts - 2006
|
|
An Environmental Change Detection and Analysis Tool Using Terrestrial VideoJavier Velez & Seth TellerContextHumans are very good at noticing differences in short sequences of videos. Given two video sequences of the same environment, a human operator can quickly see major differences between the sequences (provided that the videos are short enough). However, as the video sequences become longer, it becomes more time consuming for a human operator to detect changes in the underlying environment videotaped. In the case where only a small fraction of frames contain any differences, a human operator will waste most of their time viewing frames where no changes occurred. The problem becomes even harder if the video sequences are not synchronized to each other (such as when the sequences have different timings and/or follow slightly different paths of the environment). Now an operator must synchronize the video sequences and re-time them by hand before searching for changes. The SystemOur goal is to create a system to help focus the resources (namely time and energy) of an operator trying to detect changes between video sequences. Our system takes in a set of videos that have been geo-tagged -- say from a camera mounted looking out the side of a vehicle driving on some roughly repeatable route through some region. The system should work with large video sequences that are hours long, not just short 3-minute sets. A single difference video is generated which contains all the relevant change information in an easy-to-understand format for the operator. The generation of a difference video means that the operator need only watch a single video sequence rather than go through the entire set of videos (if each sequence contains hours of video, this can be a substantial improvement in the time taken by the operator). Furthermore, the system can use the GPS data to place changes at specific locations in space and allow the operator to view a particular location as seen from the different video sequences loaded into the system. Figure 1 shows a screenshot of the system with two video sequences loaded. The top three image views, from left to right, show: the current frame of the primary video, the frame in the second video which most closely matches the current primary frame, and a difference image of the two frames. 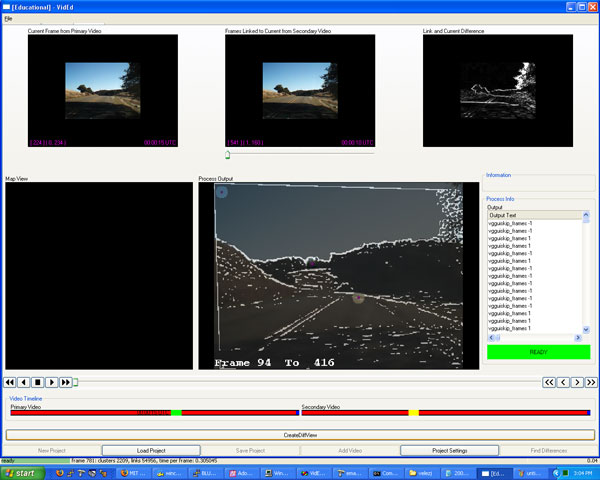
Figure 1: Matching two video sequences. The large center-bottom display shows the matching found for the last frame of the primary video. The displayed image is composed of the last frame of the primary video and the edges of the corresponding matching frame from the secondary video. Top three displays show current primary frame, current best match in secondary video, and difference image of matched frames. ApproachThe geo-tagging is accomplished by recording the serial output of a GPS receiver in the audio channel of the video (this synchronizes the GPS signal with camera frames). The system uses the GPS to coarsely synchronize the set of videos then applies a set of procedures to achieve fine-grained video synchronization between frames (including re-timing of video sequences). We use the concept of a video graph [1] to synchronize the videos. Frames are matched to one another using SIFT [2] features with a RANSAC approach and a difference video is generated. The system flags areas in the video set where significant changes occurred, allowing the operator to spend minimal time scanning frames which contain little to no changes in them. References:[1] Peter Sand and Seth Teller. Video Matching. In ACM Transactions on Graphics (TOG), pp. 592-599, 22, 3, 2004. [2] David G. Lowe. Distinctive image features from scale-invariant keypoints. In International Journal of Computer Vision, pp. 91-110, 60, 2, 2004. |
|||
|