| Research Abstracts Home | CSAIL Digital Archive | Research Activities | CSAIL Home |
![]()
|
Research
Abstracts - 2007
|
|
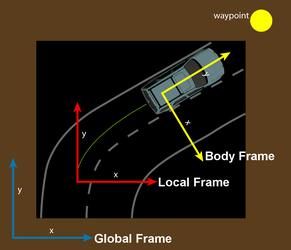
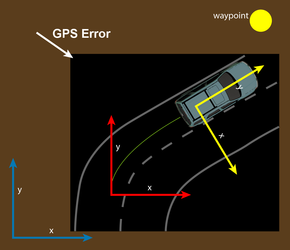
Perception and Navigation for the DARPA Urban ChallengeDavid C. Moore, John Leonard & Seth TellerOverviewThe DARPA Urban Challenge is a competition between autonomous vehicles to navigate a 60-mile course in a mock urban environment, obey traffic laws, plan routes, and visit a series of checkpoints, all without human intervention. The competition, which takes place on November 3, 2007, differs from the previous DARPA Grand Challenges in 2004 and 2005, in that it requires vehicles to rely primarily on local perception for navigation instead of GPS. This new emphasis on perception arises because driving situations such as navigating intersections and following lane markings require the vehicle to respond and make decisions in real time based on the perceived state of other vehicles and road conditions. A number of CSAIL students and faculty are participating in the MIT Urban Challenge Team because these perception challenges offer opportunities for new research in the areas of computer vision, robotic navigation, and sensor fusion. Specifically, the work described herein focuses on two main contributions to the project: Lane following using computer vision and a novel strategy for managing sensor data in a GPS-deprived environment. This work has an emphasis on speed, system engineering, and robustness to enable it to perform under the real-world conditions required by the Challenge. Coordinate Frames for Managing Sensor DataOur perception system for the Challenge has numerous sensor modalities: Planar laser scanners (LIDAR), cameras, RADAR, GPS, an inertial measurement unit (IMU), and wheel odometry. The typical approach to dealing with this type of data is to project it all into a map of the environment and then perform reasoning about vehicle control directly on the map. This provides a convenient abstraction barrier between the different sensors and the planner. However, care must be taken when generating this map. Ideally, we would like the map to exactly represent the true state of the world, where each piece of data is registered with its position relative to the Earth. In reality, GPS is one of our most unreliable sensors due to multipath and obstruction. Thus, we construct the map in a local frame that is derived from purely relative observations and only translate to GPS coordinates as needed by mission requirements such as hitting checkpoints and parking (which occur infrequently).
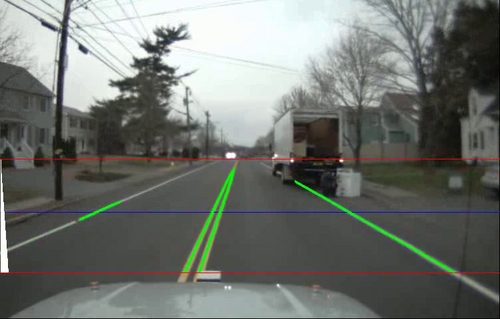
Our perception software deals with four different coordinate frames. The local frame is nominally fixed relative to the Earth, and the vehicle's position in it is updated using dead-reckoning, fusing odometry and IMU data. In this frame, the vehicle's position is defined to be exact, with no covariance estimate. It has the property that over short time scales, the vehicle's motion will vary smoothly and be close to reality. Self-consistency over long time scales is not a goal of the local frame. The global frame is fixed relative to GPS coordinates. We compute the transformation between the global and local frame as new GPS measurements arrive. It will be self-consistent over long time scales, but there may be errors and discontinuities over short time scales. The body frame has its origin at the center of the vehicle's rear axle, and moves relative to the local frame as the vehicle moves. The chassis frame has an origin somewhere on the vehicle's rigid structure. It is very similar to the body frame, except moves slightly relative to the body frame because of the suspension system between wheels and chassis. The transformation between the two is measured over time using sensors in the suspension. Sensor measurements from the cameras, LIDARs, and RADARs comes in relative to the chassis frame (we consider the sensors to be fixed relative to the chassis). We then transform from chassis to body, then from body to local, and then insert this information into the local map. It will remain accurate for short time scales because of the high accuracy of dead-reckoning. Over longer time scales, data will be discarded from the local map, since the vehicle will have moved where it is no longer relevant. In this way, perceptual information cannot be corrupted by GPS errors, because if a gross GPS error occurs, the perception information will stay fixed relative to the vehicle in the local frame, as shown in Figure 1. From time to time, we will need to perform actions that are specified by DARPA in the GPS frame. This includes hitting checkpoints and parking. When this need arises, we will transform the target point from the global frame to the local frame, and then let the planner run. Although this transformation is sensitive to GPS errors, it is a necessary compromise since the DARPA specifies these mission goals only in the global frame. Lane Finding with Computer VisionOne of the Challenge's new requirements beyond previous challenges is that the vehicle must be able to cope with distant GPS waypoints by following the natural curves of the road in between. We achieve this by detecting line markings using computer vision applied to camera data.
Our algorithm consists of several steps:
Figure 2 shows a preliminary result of the this algorithm with steps 1 and 2 implemented, and limited form of step 3. AcknowledgementsThanks to Albert Huang for assistance with the coordinate frame figures. |
|||||||||
|
||||||||||