| Research Abstracts Home | CSAIL Digital Archive | Research Activities | CSAIL Home |
![]()
|
Research
Abstracts - 2007
|
|
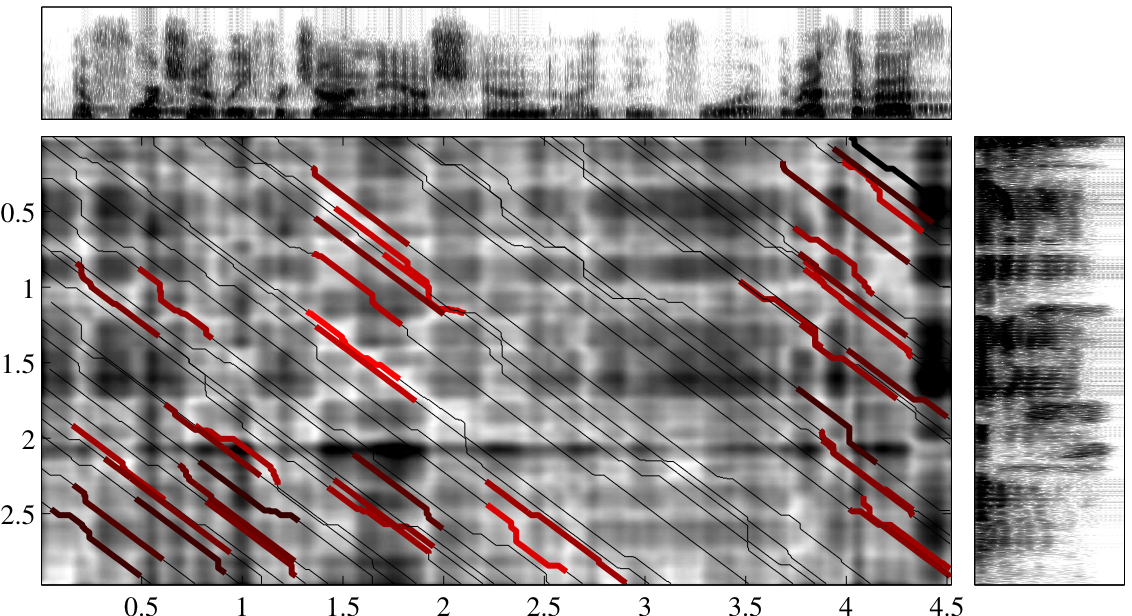
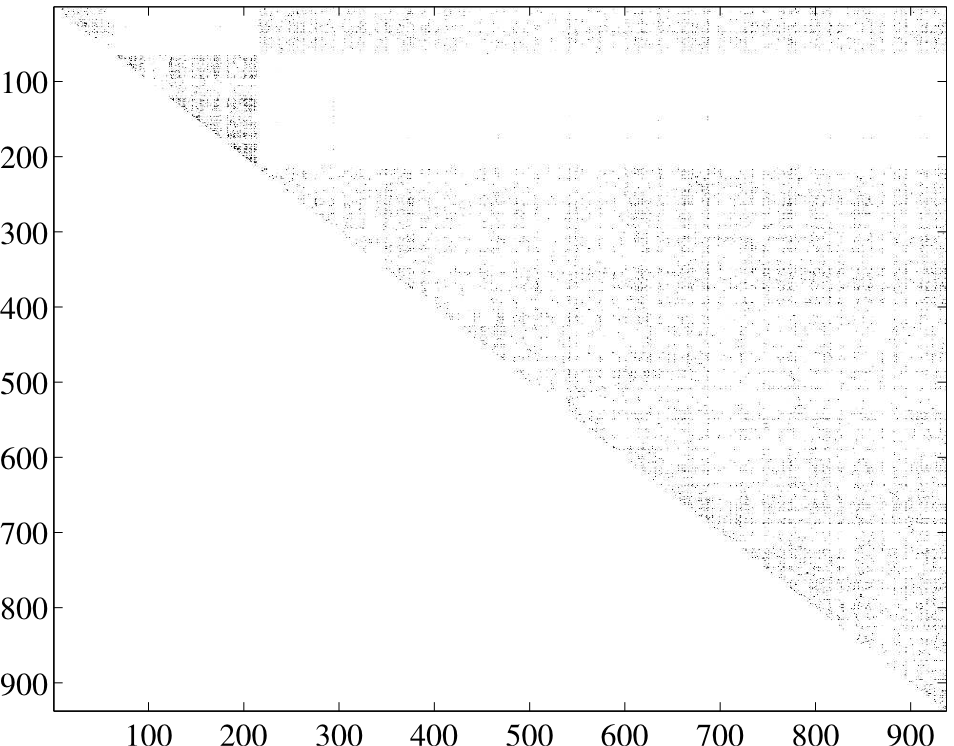
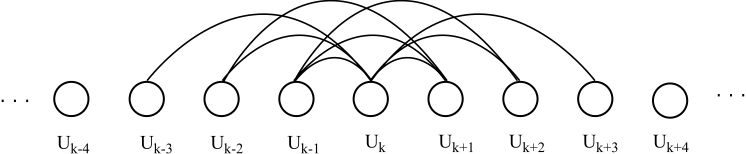
Speaker Segmentation Based on Acoustic Pattern DiscoveryAlex S. Park & James R. GlassIntroductionWe examine the problem of speaker segmentation, also known as speaker change detection. There are two main motivations for segmenting an audio stream by its constituent speakers. First, for audio documents, speaker changes are often considered natural points around which to structure the document for navigation by listeners. In broadcast news, for example, speaker changes typically coincide with story changes or transitions. Audio recordings of meetings, presentations, and panel discussions are also examples where organizing audio segments by speaker identity can provide useful navigational cues to listeners. A second motivation for speaker segmentation relates to automatic transcription of speech. In many scenarios, the performance of automatic speech recognition can benefit greatly from speaker adaptation, whether supervised or unsupervised. Speaker segmentation, while not a strict pre-requisite for speaker adapation, is important for performing adaptation on multi-speaker data, as it can provide the recognizer with homogenous speaker data. ApproachThe approach we follow consists of several steps. First we apply silence detection to the audio waveform to extract a set of continuous spoken utterances from the audio stream. Next, we apply segmental dynamic time warping (DTW) to every pair of utterances to obtain distances between recurring patterns within each pair of utterances. Finally, we use these distances to generate a distance profile over the entire audio stream. We determine candidate speaker change points by picking peaks in the distance profile. Segmental DTWOur algorithm utilizes a novel distance metric for comparing two spoken utterances. This distance metric is based on a local variant of dynamic time warping (DTW) that we call segmental DTW. Our approach is based on the idea of finding word-level speech patterns that are repeated by the same speaker. The rationale is that recurring acoustic patterns spoken by the same speaker will be more similar than those spoken by different speakers. Given two continuous speech utterances, X and Y, we find similar sounding speech patterns by searching the distance matrix for low-distortion alignments between the utterances. The distance matrix specifies the pairwise Euclidean distance between corresponding frames from the utterances being compared. Alignments are computed using the segmental DTW algorithm, as shown in Figure 1. Each alignment defines a mapping of a portion of X to a portion of Y, along with a distortion score that quantifies how much these portions differ. We select the alignment with the minimum distortion score to represent the distance between X and Y, d(X,Y). A more detailed exposition of the segmental DTW algorithm is provided in [1]. Distance ProfileOnce distances have been obtained, it is possible to generate an adjacency matrix, which summarizes distances between all pairwise combinations of utterances. The adjacency matrix for an example audio stream is shown in Figure 2. This adjacency matrix exhibits a clear block structure, with change points in the lecture delineated by abrupt discontinuities in the number of cells with low distances. This output illustrates that using distances based on the most similar patterns between utterances can be useful for identifying within speaker regularity. Using the adjacency matrix, we can generate a distortion profile for the entire audio stream by calculating the normalized sum of cells representing distances between nearby . These distances are illustrated in Figure 3. The subset of distances used to compute the distortion profile corresponds to a triangular window of cells along the main diagonal in the adjacency matrix.
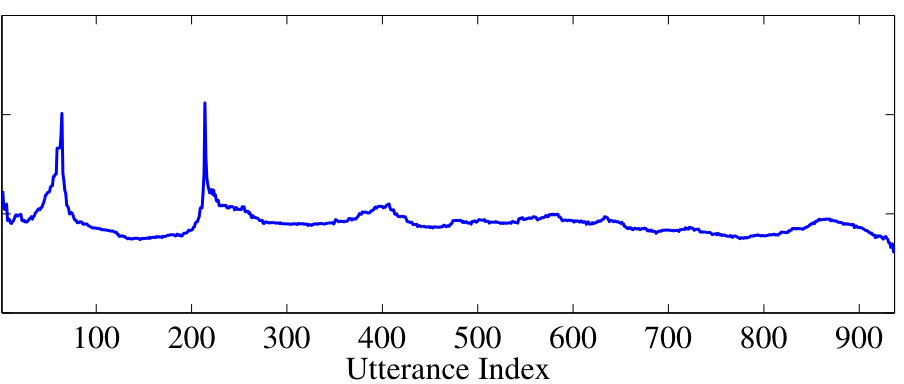
The log distortion profile that is generated for our example audio stream is shown in Figure 4. This profile appears to have distinct peaks that coincide with the reference boundaries, as we would hope. We select candidate change points by thresholding a smoothed vesion of the profile to extract the most prominent peaks.
DataWe used our segmentation algorithm to find speaker changepoints for 6 multi-speaker lectures recorded as part of the MIT World initiative. These lectures are summarized in Table 1 The subject material contained within the lectures is wide-ranging; topics include hurricane relief response, medical technology, weapons proliferation policy, and quantum mechanics. In all, the data represents more than ten hours of speech contributed by at least 25 different speakers. One of the useful aspects of this data is the availability of high level reference segmentations provided by organizers of the MIT World site. Each lecture is accompanied by a summary page which includes an index of major landmarks in the lecture as judged by a human listener. For the most part, these landmarks typically correspond to speaker changes, but not all speaker changes are included. For instance, minor speaker turns occuring as part of a question and answer session are not individually labeled, but are grouped together as a separate section. Since these landmarks are intended to help guide listeners to important times in the lecture, we focus on the task of automatically finding these landmarks and not just arbitrary speaker changes. In some ways, using these landmarks as our target references is less ambitious than traditional speaker change detection tasks as it does not require exhaustively finding all speaker changes. On the other hand, determining how to select the particular change points that constitute important boundaries to human listeners is also a nontrivial task.
ResultsThe results of our segmentation procedure are summarized in Table 2. Rather than use a floating threshold which yields a detection error tradeoff curve, we instead use a fixed threshold and evaluate the precision and recall of the resulting segmentation. Our reason for doing this is because for actual deployment, an actual segmentation is desirable, meaning the utility of the algorithm is strongly tied to the threshold selected. For our evaluation, a hypothesized boundary is marked as correct if it falls within seven utterances of a true boundary. In temporal terms, we observed that the average distance between those hypothesized boundaries marked as correct and reference boundaries was 8.5 seconds. Table 2 shows that with the development-set selected threshold, the overall recall rate is 100.0%, meaning that all of the human annotated boundaries are found by our segmentation procedure. The overall precision rate is 80.0%, meaning that of the 35 boundaries proposed, seven were not on the list of human-proposed boundaries. It should be noted, however, that all of these "false alarms" actually do correspond to speaker change boundaries that are simply not annotated in the reference. Therefore, while these proposed boundaries should still be considered errors in the context of our experiment, they may not necessarily detract from the performance of the system when actually deployed. For the most part, false alarms generally occur in the last segment of each lecture, which corresponds to the question and answer section where multiple, unlabeled speaker changes take place. Aside from these few false alarms, the automatic boundaries correlate well with the reference boundaries, indicating that our proposed procedure may prove useful for providing navigational boundaries for this particular task. References:[1] A. Park and J. Glass, Towards Unsupervised Pattern Discovery in Speech. In Proc. IEEE Workshop on Automatic Speech Recognition and Understanding, San Juan, Puerto Rico, December 2005. [2] A. Park and J. Glass, A Novel DTW-based Distance Measure for Speaker Segmentation. In Proc. IEEE Workshop on Spoken Language Technology, Palm Beach, Aruba, December 2006. |
|||||||||||||||||||||||||||||||||||||||||
|
||||||||||||||||||||||||||||||||||||||||||