| Research Abstracts Home | CSAIL Digital Archive | Research Activities | CSAIL Home |
![]()
|
Research
Abstracts - 2007
|
|
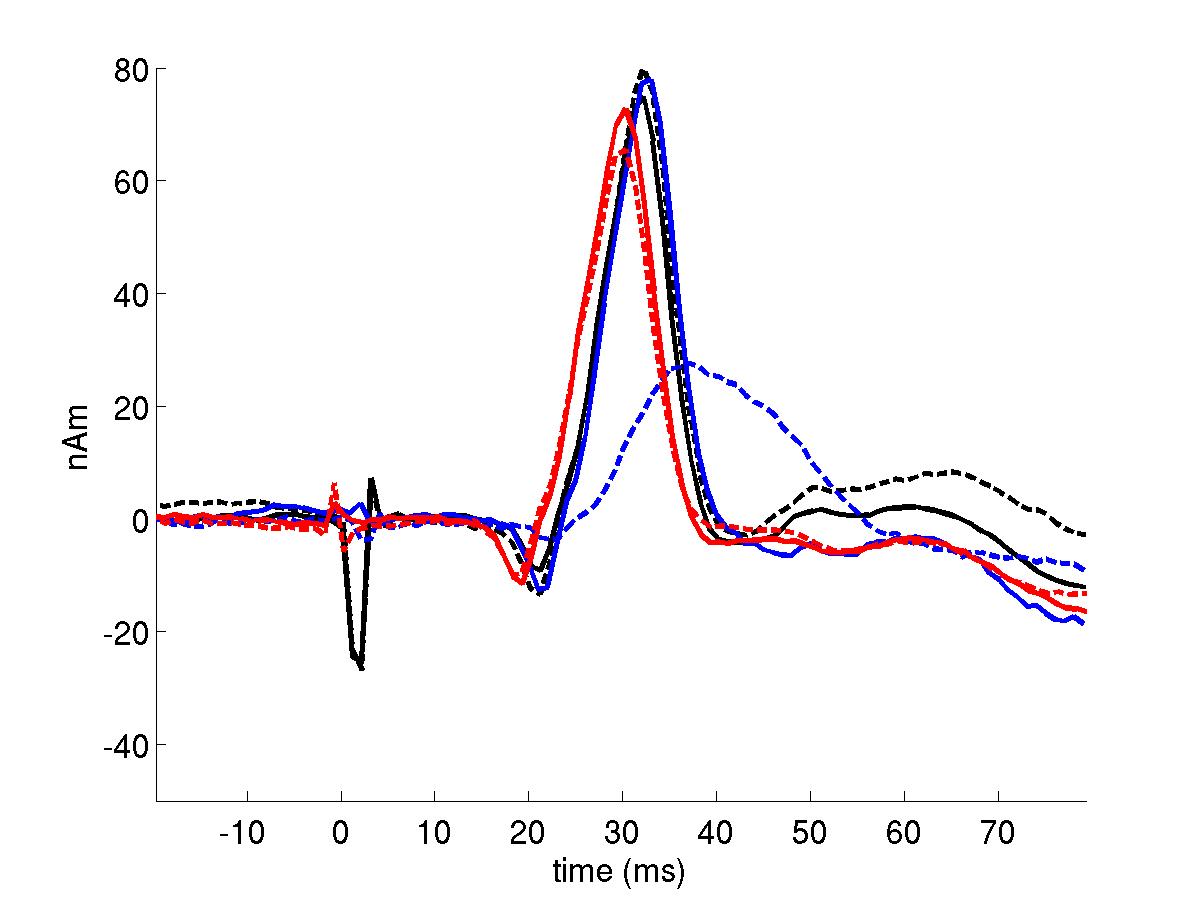
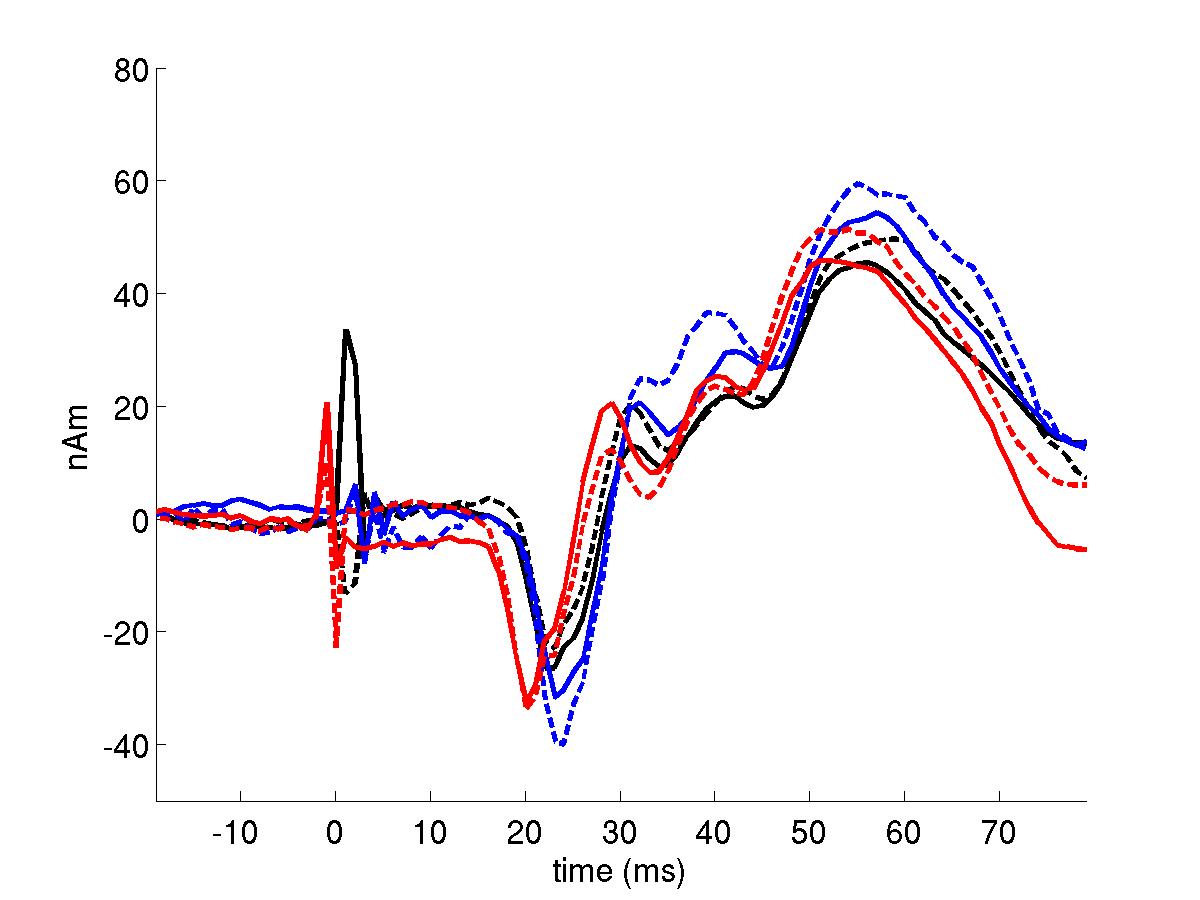
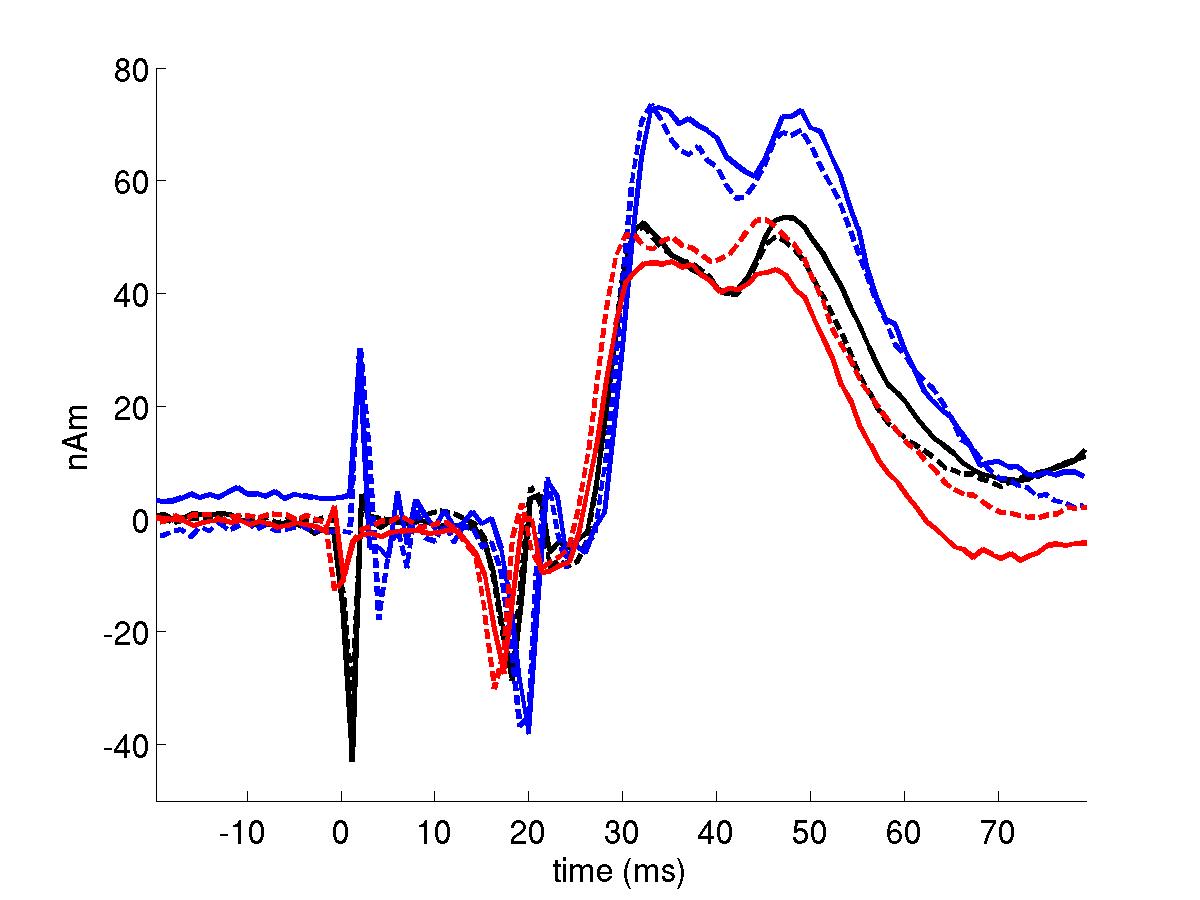
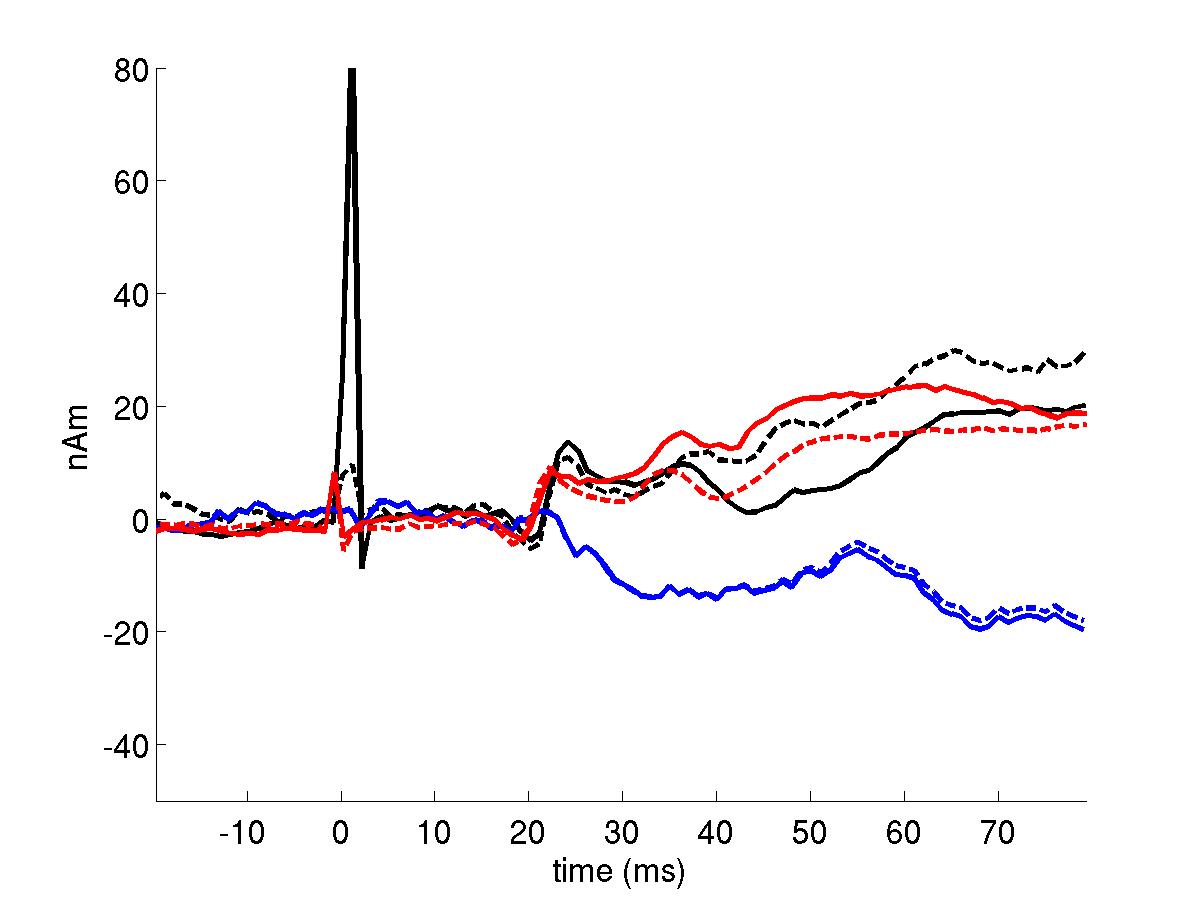
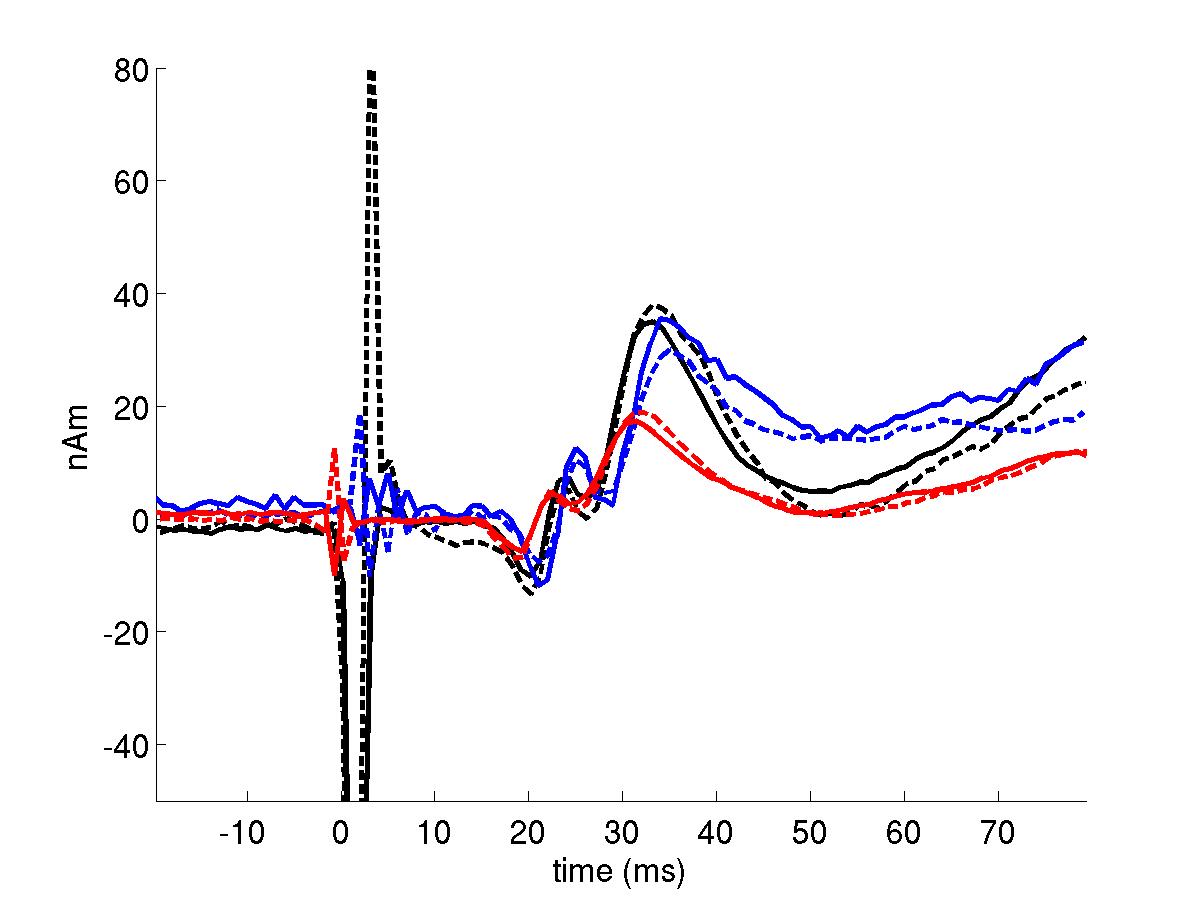
Characterizing and Modeling Sources of Variation in MEGWanmei Ou, Polina Golland & Matti HämäläinenSummaryOur study of inter-subject and inter-scanner differences in Magnetoencephalography (MEG) reveals that MEG scanners can consistently capture subjects neuronal responses. Inter-subject variation is the primary source of variation in MEG data. Background and ProblemMEG is a noninvasive technique for investigating neuronal activity in the living human brain [1]. Compared with functional magnetic resonance imaging (fMRI), MEG provides a more direct measure of neuronal activity and a substantially higher temporal resolution. Electroencephalography (EEG) and MEG provide complementary information of the same source of activation. Due to the conductivity pattern in the skull and scalp, MEG often achieves better source localization than EEG. A multi-institute project aims to compare three different MEG systems: the 306-channel VectorView system at the Massachusetts General Hospital, the 248-channel Magnes 3600 WH system at University of Minnesota, and the 275-channel Omega275 system at The MIND Institute. MEG scans of five control subjects were recorded at the three sites over two visits to each site. Each visit comprised four different types of stimulus: auditory, median nerve, index finger, and visual. For each stimulus type, a subjects experienced multiple trials from both left and right simulations, and possibly varying strength of the stimulus. In this report we analyze the data from the left median nerve simulation, with total 300 trials (some trials were removed due to significant eye movement). Comparison is conducted in the source space, i.e. the space of estimated current source in the cortical surface. Our work focuses on both early deflection time and amplitude of the estimated current source. Variance Component AnalysisThe unique structure of the data leads to multiple sources of variation, including variation among different trials in a single visit, between visits at a single scanner, among MEG systems, and among subjects. Preliminary study on this data set has been report in [2], where authors mainly focused on differences in the signal space: the measurements from MEG sensors. It has been reported that early deflections in MEG signals associated with median nerve simulation demonstrate precise timing among normal subjects, i.e. N20m and P30m. Each panel in Figure 1 presents the estimated current signals for one subject over two visits to each of the three sites. Most subjects, except subject 2, and subject 4 who has left-hand deformity, have consistent signals. Subject variation is the primary source of variation in the data.
Source of variation is modeled using a standard Bayesian model, rather than the conventional ANOVA model, in order to avoid negative variance estimates. Our results (Figure 2 (a) and (b)) show that such variation mainly comes from subject variation, and the subject variability contributes at least 65% of the total variability (total MSE) in the data. On the other hand, panels corresponding to subject 3 and 4 in Figure 1 depict variation in N20m and P35m amplitude with respect to the three systems. Since amplitude difference only occurs in specific subjects, the variation can be contributed by a joint scanner-subject effect. This observation agrees with our analysis results in Figure 2 (c) and (d), where the variability is larger in joint scanner-subject effect than the scanner effect. |
 |
 |
 |
 |