
| Research Abstracts Home | CSAIL Digital Archive | Research Activities | CSAIL Home |
![]()
|
Research
Abstracts - 2007
|
|
TaintTrace: Efficient Flow Tracing with Dynamic Binary RewritingWinnie Cheng, Qin Zhao, Bei Yu & Scott HiroshigeIntroductionCritical vulnerabilities and security exploits are the norms in today's computer systems. While the Internet has enhanced our communication, it is a primarily unregulated infrastructure where users are susceptible to malicious attacks. Worms like CodeRed and CodeRedII are capable of spreading to thousands of victims within minutes. Signature-based scanning is often too slow to respond to these attacks. Hence, a protection mechanism should provide immunity to known as well as unknown attacks. Dynamic taint tracing has been proposed to counter exploits from critical vulnerabilities. This technique keeps track of the propagation of untrusted (tainted) data during program execution. Tainted data may represent sources such as user input, packets from the network, or data read from specific files and devices. Taint tracing is based on a program's dynamic behavior. Unlike virus scanners that require known attack signatures, dynamic taint tracing can defend against future attacks. In a summary of vulnerabilities in the Red Hat operating system, buffer overflow and overwrite attacks were identified as the dominating culprits [2]. Attacks on these vulnerabilities can be easily avoided with data flow tracing. Currently, there are three ways to track taint information on data:
These approaches have various drawbacks. Interpreter-based approaches can protect only against vulnerabilities in language-specific code. An architecture-based approach requires custom hardware support. Furthermore, a hardware approach makes it difficult for system administrators to tailor security policies for individual software applications. An instrumentation-based approach suffers significant performance overhead prohibiting its use in real-time applications. For example, TaintCheck[6] demonstrated a slowdown of over 30 times when compared against native execution. The overhead is primarly due to the way taint information is maintained and propagated. ApproachWe designed and implemented a new tool called TaintTrace. Here we give a brief overview of TaintTrace; more information can be found in [1]. TaintTrace uses an instrumentation approach to dynamically trace the propagation of taint data. It is based on DynamoRIO[7] and consists of a number of optimizations to keep the overhead low. It is able to protect against a broad set of exploits such as format string and buffer overflow. Our approach has the following attractive properties:
Our system consists of four components. A configuration file is used to specify the security policy for an application. The shadow memory is a data structure used to maintain the taint information of application data. The program monitor is the core module used to perform the instrumentation, intercept system calls, and enforce security policies. A customized loader is used to load the application binary, shadow memory, and program monitor into different memory spaces. To start an application, our loader first loads the various components into specific memory spaces and then passes control to the program monitor. The program monitor reads the configuration file and sets up the tracing policy. We associate each general purpose register and each byte of memory with a shadow memory byte to maintain its taint status: 1 represents tainted and 0 represents untainted. We define the residence of tainted data to be a memory location or a register. The taint tracing policy defines how information flow is tracked as tainted data propagates among different residences. This can happen in four ways as instructions are executed:
Our default tracing policy covers propagation types 1 and 2. It maintains the invariant: the output (destination) data is tagged as tainted if and only if any of the input (source) data is tainted. PerformanceWe evaluated our taint tracing tool with synthetic exploits based on published vulnerabilities [8]. Our tool was effective in detecting these attacks. We also benchmarked the performance of TaintTrace using a subset of the industry-standard SPEC2000 INT. Our evaluation was done on a system with 2.8GHz Pentium 4 processor, 1024K L2 Cache, 1024MB of RAM, and 2048M swap, running Fedora Core 3. For each workload, we measured the running time of native execution, execution with our tracing tool, and execution with Valgrind Memcheck [9]. 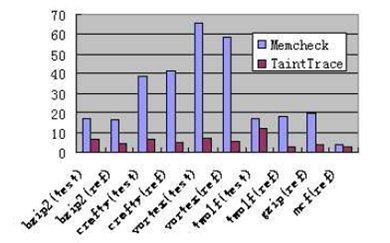
As can be observed from the figure, TaintTrace significantly outperforms Valgrind Memcheck on most workloads. The average slowdown of our tracing tool over all the workloads is 5.53. It is much smaller than Valgrind Memcheck's average slowdown of 29.62. We did not compare our tracing tool with TaintCheck [6] due to the lack of their source code. However, as reported in their paper, their performance is worse than that of Valgrind Memcheck. References:[1] W. Cheng, Q. Zhao, B. Yu and S. Hiroshige. TaintTrace: Efficient Flow Tracing with Dynamic Binary Rewriting. In Proocedings of the 11th IEEE Symposium on Computers and Communications, 2006. [2] Classification of Red Hat security alerts. http://www.and.org/vstr/security problems.html. 2003 [3] Perl security manual page. http://www.perldoc.com/perl5.6/pod/perlsec.html. [4] G. E. Suh, J. Lee, D. Zhang, and S. Devadas. Secure program execution via dynamic information flow tracking. In ASPLOS-XI, 2004. [5] J. R. Crandall and F. T. Chong. Minos: Control data attack prevention orthogonal to memory model. In MICRO-37, 2004. [6] J. Newsome and D. Song. Dynamic taint analysis for automatic detection, analysis, and signature generation of exploits on commodity software. In 12th Annual Network and Distributed System Security Symposium, 2005. [7] D. Bruening. Efficient, Transparent, and Comprehensive Runtime Code Manipulation. PhD thesis, Massachusetts Institute of Technology, September 2004. [8] J.Wilander and M. Kamkar. A comparison of publicly available tools for dynamic buffer overflow prevention. In 10th Network and Distributed System Security Symposium, 2003. [9] N. Nethercote. Dynamic Binary Analysis and Instrumentation. PhD thesis, University of Cambridge, November 2004. |
|||
|