| Research Abstracts Home | CSAIL Digital Archive | Research Activities | CSAIL Home |
![]()
|
Research
Abstracts - 2007
|
|
Finding and Fixing Memory Leaks in Java ProgramsDerek Rayside, Lucy Mendel & Daniel JacksonWhy are memory leaks a problem?Memory leaks can cause programs to slow down or crash, and can also limit the size of the input that the program can process in a given memory space. Memory leaks are notoriously hard to find and fix, because it is difficult to discern meaningful patterns in the program's heap, and because it is difficult to correlate memory consumption to lines of source code. We use an ownership inference to tackle the first problem, and an interactive hierarchical matrix browser to tackle the second. We call our technique object ownership profiling. What is a memory leak?A memory leak is storage is allocated but that the program no longer needs. The most common mechanical criteria used to determine if a program still needs some bit of storage is whether that memory can be reached from the current call stack or global variables — that is, whether that memory is root reachable. Storage that is allocated but not root reachable is clearly a leak: there is no possible way for the program to use that storage again. Automatic storage reclamation, or garbage collection, releases storage that is allocated but not root reachable, and thereby precludes these kinds of leaks. Programs written in garbage collected languages, such as Java, can still have memory leaks: storage that is root reachable, but no longer needed by the program. One way to charaterise this kind of leak is storage that is no longer observably reachable: ie, if this storage were released, it would have no observable effect on the program, even though it is technically root reachable. Figure 1 shows a Venn diagram of the memory reachability hierarchy we have just described. There are two kinds of leaks illustrated by this diagram: storage that is allocated but not root reachable, and storage that is root reachable but not observably reachable. In this work we focus on the second kind of leak. 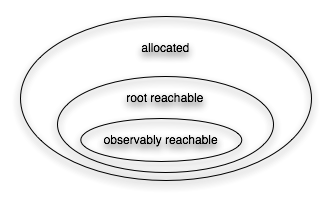
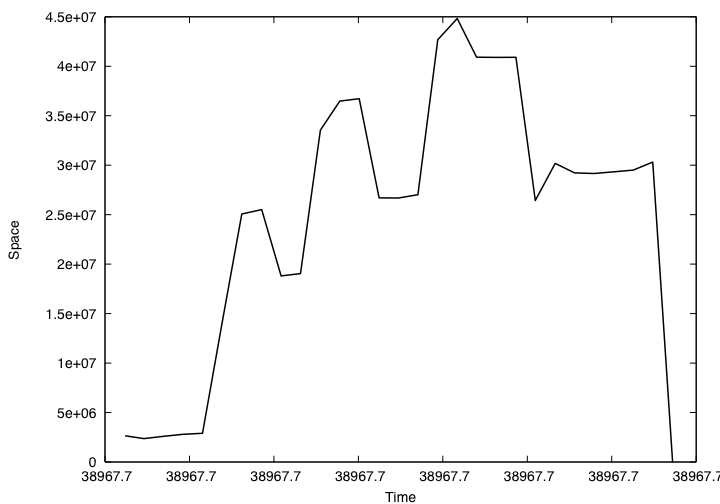
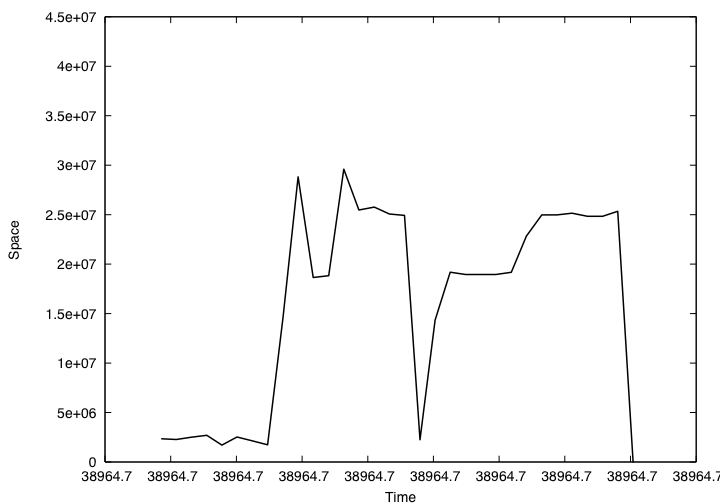
Figure 1: memory reachability hierarchy Finding LeaksThere are three phases in our leak-finding analysis: identify potentially leaked objects, infer a hierarchy of objects, and rank nodes in the hierarchy for programmer inspection. We identify potentially leaked objects by instrumenting the program to record every time the program uses that object, and when the garbage collector releases the object. During this "drag" time the object is a potential leak. Observing an object in this way under-approximates whether it is observably reachable, because if the program had happened to take another branch, it might have used that object. However, this under-approximation is useful in diagnosing leaks. A program execution may contain millions of objects, so simply knowing which objects are potential leaks and for how long is not enough: the analysis must also provide a way to structure and rank objects. We use ownership inference to infer a hierarchical structure on the objects in a program trace. Potential leaks are aggregated up this hierarchy — similarly to how file sizes are aggregated up the directory structure when profiling disk usage. In the third place, our technique ranks ownership nodes in two ways: according to the integral of leaked space over time, and whether new incoming pointers were created to them after they stopped being active ("zombie references"). Fixing LeaksFixing leaks can be difficult. Even if the programmer knows what objects are leaked, determining how to change the source code to prevent that leak in future is often non-obvious. We use a hierarchical matrix browser for the programmer to explore the interactions between the potential leak and the other objects in the program execution. These interactions include all method calls (which our dynamic analysis also records), in addition to field operations. This hierarchical matrix browser is illustrated below in Figure 3. Case Study: Finding and Fixing a Leak in an IDEHere we present a memory leak that our technique found in the Alloy Analyzer (version 3). The Alloy Analyzer is an IDE for the Alloy language; it's main components are a translator from Alloy to SAT, an external SAT solver, and a visualizer. The Alloy Analyzer is written in Java, with the exception of the external SAT solver, which is third party code written in C. We are looking for memory leaks in the Java code. Figure 2a shows a Java heap profile of the Alloy Analyzer v3 on a workload of two translations, before the memory leak was fixed. Figure 2b shows the profile on the same workload after the leak was fixed. Notice that the memory allocated for the first translation is now released before the second translation begins, and consequently the peak memory requirement is reduced from 45MB to 30MB. These heap profiles were captured with Sun's JConsole tool that ships with JDK6. These plots verify, independently of our tools, that we did indeed fix leaks in the Alloy Analyzer v3.
Figure 2: Java heap profiles of Alloy Analyzer v3, captured with Sun's JConsole tool As an example, we will explain how one of these leaks was found and fixed with our tools. (Discussion of the other leaks is elided here for space considerations.) Figure 3 shows a subset of the ownership profile captured by our tool. Each plot in Figure 3 represents the memory profile of an ownership node, and the arrows between nodes indicate the ownership hierarchy. The red (top) lines on the plots represent allocated objects, and the green (bottom) lines on the plots represent active objects (ie, objects that were observed to have been reached). A gap between the two lines indicates objects that were allocated but not observably reachable — a potential leak. In Figure 3 we see, on the far right, that there are some large 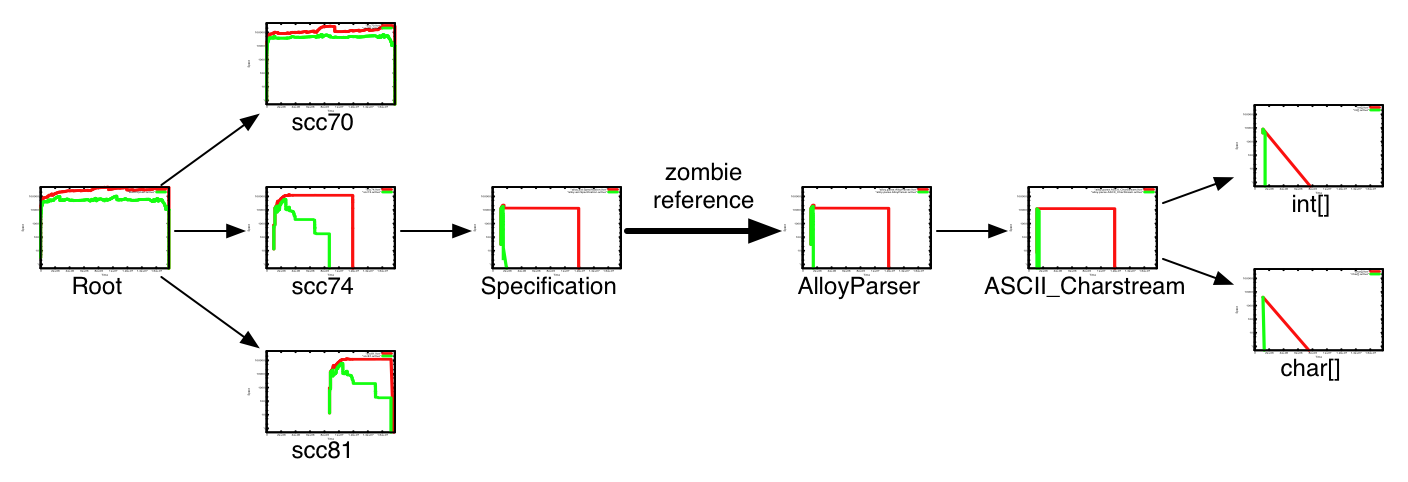
Figure 3: ownership profile for Alloy Analyzer v3 (with leak) Now that we know where a potential leak is, we use the hierarchical
matrix browser to show the interactions between the (potentially) leaked
objects and the rest of the objects, as pictured in Figure 4. First we
see that the leaked 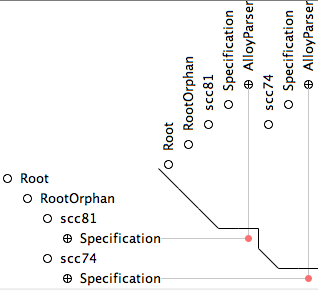
Figure 4: interactive hierarchical matrix browser This example illustrates the power and utility of our analyses: only
a few lines of code needed to be changed to fix the leak, but those lines
were nowhere near the observable symptom (leaking ConclusionObject ownership profiling is an effective and intuitive technique for finding and fixing memory leaks in Java programs: it both identifies the leaking objects, and places in the source code that may need to be modified to fix the leak — places that may be far away from, and only indirectly related to, the leaked objects. We are conducting further empirical research on object ownership profiling, including investigating different bases for determining object ownership. We are also implementing engineering enhancements and exploring improvements to the user interface. AcknowledgementsThis research was supported, in part, by grants 0086154 (Design Conformant Software) and 6895566 (Safety Mechanisms for Medical Software) from the ITR program of the National Science Foundation. References:Derek Rayside, Lucy Mendel, and Daniel Jackson. A Dynamic Analysis for Revealing Object Ownership and Sharing. Fourth International Workshop on Dynamic Analysis (WODA 2006), associated with the International Conference on Software Engineering (ICSE'06). Shanghai, China. May, 2006. Best paper award (as voted by workshop participants). (PDF) Derek Rayside, Lucy Mendel, Robert Seater, and Daniel Jackson. An Analysis and Visualization for Revealing Object Sharing. Eclipse Technology Exchange (ETX) Workshop at OOPSLA'05. (PDF) David G. Clarke, John M. Potter, and James Noble. Ownership types for flexible alias protection. OOPSLA'98. James Noble, Jan Vitek, and John M. Potter. Flexible Alias Protection. ECOOP'98. |
|||||||
|